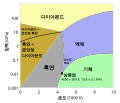
File:Carbon basic phase diagram.png
Carbon_basic_phase_diagram.png (672 × 509 像素,檔案大小:13 KB,MIME 類型:image/png)
檔案歷史
點選日期/時間以檢視該時間的檔案版本。
| 日期/時間 | 縮圖 | 尺寸 | 使用者 | 備註 | |
|---|---|---|---|---|---|
| 目前 | 2005年9月7日 (三) 08:19 |  | 672 × 509(13 KB) | Saperaud~commonswiki | Basic phase diagram of carbon, which shows the state of matter for varying temperatures and pressures. The hatched regions indicate conditions under which one phase is metastable, so that two phases can coexist. Accurate illustration but not a pixel-exac |
檔案用途
下列頁面有用到此檔案:
全域檔案使用狀況
以下其他 wiki 使用了這個檔案:
- ba.wikipedia.org 的使用狀況
- bg.wikipedia.org 的使用狀況
- cv.wikipedia.org 的使用狀況
- da.wikipedia.org 的使用狀況
- el.wikipedia.org 的使用狀況
- en.wikipedia.org 的使用狀況
- Graphite
- List of minerals recognized by the International Mineralogical Association
- Wikipedia:Reference desk/Archives/Science/2010 December 19
- Wikipedia:Reference desk/Archives/Science/2012 November 27
- Wikipedia:Reference desk/Archives/Science/2012 December 20
- Wikipedia:Reference desk/Archives/Science/2013 May 21
- Wikipedia:WikiProject WikiFundi Content/Diamond
- User:Vanadiumfour/sandbox/Graphite
- eo.wikipedia.org 的使用狀況
- es.wikipedia.org 的使用狀況
- eu.wikipedia.org 的使用狀況
- fr.wikipedia.org 的使用狀況
- fr.wikibooks.org 的使用狀況
- hu.wikipedia.org 的使用狀況
- hy.wikipedia.org 的使用狀況
- ja.wikipedia.org 的使用狀況
- ka.wikipedia.org 的使用狀況
- lez.wikipedia.org 的使用狀況
- nl.wikipedia.org 的使用狀況
- si.wikipedia.org 的使用狀況
- sl.wikipedia.org 的使用狀況
- sr.wikipedia.org 的使用狀況
- th.wikipedia.org 的使用狀況
- tt.wikipedia.org 的使用狀況
- vi.wikipedia.org 的使用狀況
- www.wikidata.org 的使用狀況
- yo.wikipedia.org 的使用狀況


